With the IPMS Visualisation Software, everything is possible, from a small lighting control system and SmartPhone to an extensive building management system and all trades. Due to the constant further development, countless functions and design variants can now be used. IPMS is a 100% secure solution especially for the ISYGLT system.
The IPMS Visualisation from Seebacher is characterised by compatibility, stability and user friendliness. It is based on the platform-independent JAVA and is therefore executable on Windows, Linux and many other systems.
From the basic structure, the visualisation was designed as a server-client system. The IPMS Java Server (Master) must be installed on a Windows machine. This communicates with the ISYGLT Master via Ethernet. At the same time, user and message management, data logging and various other implemented tools are carried out.
No further installations are necessary on the client PCs apart from the JAVA Runtime Environment (JRE). The pages are created with the international standard programming language HTML. For secure, trouble-free operation, a browser is supplied which is included in the Java package and cannot be installed separately.
In addition to controlling our system, it is also possible to record error messages and measured values and log them.
- operation of all components of our system
- manage switching times
- error message recording
- measured value recording with graphic display
- SMS and e-mail dispatch
- user administration with rights assignment
- creating interfaces with simple HTML programming language


You can operate all trades on the visualisation. And not only from our Touch-PC or Tablet, but also from your existing PC. We are completely flexible in this respect.
Convince yourself of the design of our sample system.
Many more examples can be found here.

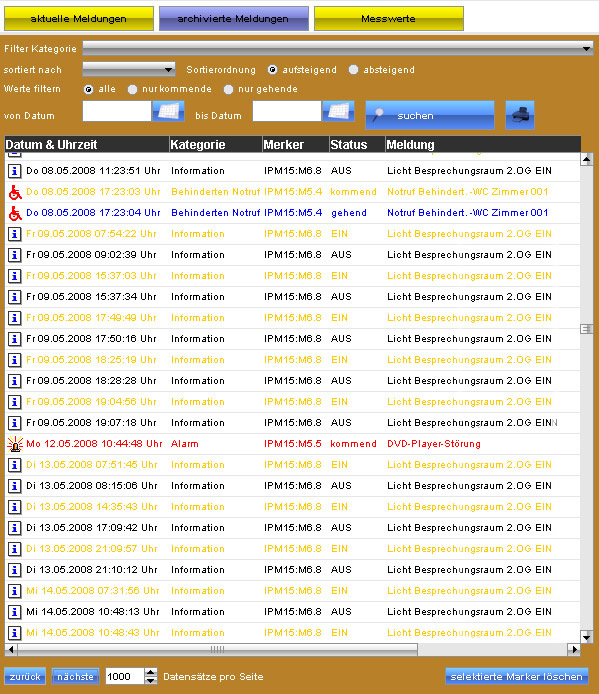
Error messages
The ISYGLT Visualisation offers extensive error message processing for monitoring the system. The error messages can be created and edited directly in the visualisation, as well as added to an error category. Each error message can be assigned, whether it must be acknowledged, which right (user) is necessary for it, whether it should be printed directly via error message printer, etc.

Measured Values
In order to record temperatures, light intensities and other measured values, our visualisation includes a measured value recording. For a better overview and convenience, individual values can be selected in a table and displayed simultaneously. The scaling of the axes, like the recording period, is freely adjustable. The values can be individually printed and exported depending on the filter setting.
To forward error messages and other events directly to the user, SMS or e-mail forwarding is recommended. A modem with an analog telephone connection allows messages of urgency to be forwarded quickly. The complete processing takes place in the visualisation. Here the mobile phone numbers and e-mail addresses of the users are indicated, as well as delay times for the dispatch. The providers for SMS services and e-mail can be configured and the fault messages can be divided into different categories.
In order to reserve functions of the visualisation only to certain persons, an internal user administration can be used if necessary. In addition to user name and password, you can specify the permission level (0-255), an individual start page, an inactive time for an automatic logout, as well as mobile phone number and e-mail address.
The requirements for visualisation are relatively low due to the JAVA basis. Only the latest JAVA Runtime Environment must be installed on the PCs.
Minimum server requirement:
- 1 GHz Processor (2 GHz minimum recommended)
- 512 MB RAM (at least 4 GB recommended)
- 2GB HDD (20GB minimum recommended)
- Network Card (LAN or WLAN)
- Windows 7/10
- Virtual machines can also be used
Minimum client requirement:
- 1 GHz Processor
- 512 MB RAM
- 1 GB HDD
- Network Card (LAN or WLAN)
- Windows XP/Vista/7/10 or Linux
Care should be taken that the computers are certified for 24/7 operation. The use of an uninterruptible power supply (UPS) is strongly recommended for the server. For the clients, a UPS is also recommended for long and secure operation.
IPMS Visualisierung
Article no.: 80800050


